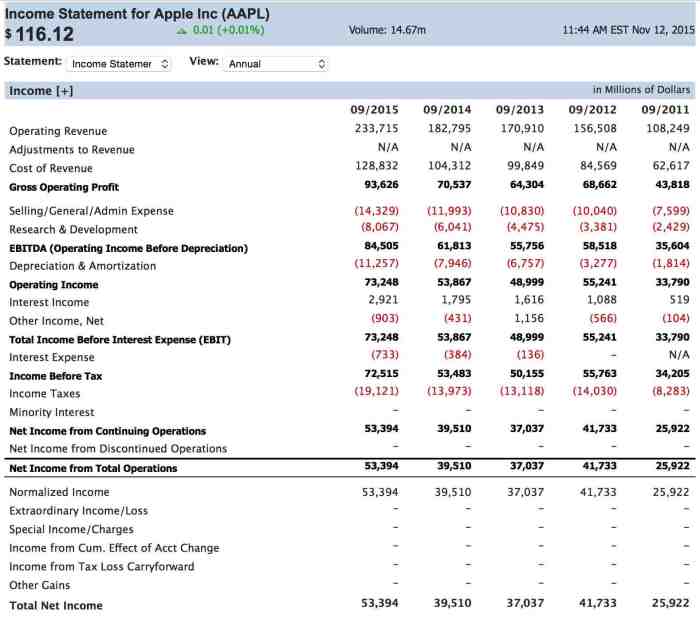
Dive into the world of Understanding Income Statements to discover the hidden treasures of financial insights and revelations. Get ready to unravel the mysteries behind revenue, expenses, and profitability metrics in this exciting journey of financial exploration.
Understanding the basics of income statements
An income statement is a financial document that shows a company’s revenues and expenses over a specific period of time. It helps investors, analysts, and other stakeholders understand the profitability of a business.
Purpose of an income statement
An income statement serves to show whether a company is making a profit or experiencing a loss. It provides valuable insights into the financial performance of a business and helps in decision-making processes.
Typical components of an income statement
- Revenue: The total amount of money generated from sales or services.
- Expenses: The costs incurred by the company to generate revenue.
- Gross Profit: Revenue minus the cost of goods sold.
- Operating Income: Gross profit minus operating expenses.
- Net Income: The final profit after deducting all expenses from revenue.
Types of income statements in various industries
| Industry | Income Statement Type |
|---|---|
| Retail | Multi-step income statement |
| Manufacturing | Contribution margin income statement |
| Service | Single-step income statement |
Analyzing revenue on income statements
Revenue plays a crucial role in income statements as it represents the total amount of money earned by a company during a specific period. Understanding how revenue is recorded and recognized is essential for evaluating a company’s financial performance.
Revenue is typically recorded on an income statement when it is earned, regardless of when the cash is actually received. This concept is known as the revenue recognition principle, which ensures that revenue is recognized in the period in which it is earned, even if the cash has not been received yet.
Gross Revenue vs. Net Revenue
Gross revenue refers to the total amount of revenue generated by a company from its primary business activities before any deductions. On the other hand, net revenue is the amount of revenue left after deducting any discounts, returns, or allowances.
For example, if a company sells products worth $100,000 but offers discounts amounting to $10,000, the gross revenue would be $100,000, and the net revenue would be $90,000.
Impact of Revenue Recognition on Income Statements
Revenue recognition can significantly impact income statements, especially in cases where revenue is recognized prematurely or deferred. For instance, recognizing revenue before it is actually earned can artificially inflate a company’s financial performance, leading to misleading results.
On the other hand, deferring revenue recognition can make a company’s financial performance appear weaker than it actually is, which might affect investor perceptions and decision-making.
In conclusion, understanding how revenue is recorded on income statements, the difference between gross revenue and net revenue, and the impact of revenue recognition on financial statements is crucial for accurately assessing a company’s financial health.
Understanding expenses and their classification
When it comes to income statements, understanding expenses is crucial for evaluating a company’s financial health. Expenses represent the costs incurred by a business to generate revenue and operate efficiently. Let’s dive into the different types of expenses typically found on income statements and how they are classified.
Types of expenses
- Operating Expenses: These are day-to-day expenses incurred in the normal course of business operations. Examples include salaries, rent, utilities, and office supplies.
- Cost of Goods Sold (COGS): This represents the direct costs associated with producing goods or services sold by the company. It includes raw materials, labor, and manufacturing overhead.
- Non-Operating Expenses: These are expenses not directly related to the core business activities, such as interest expenses, taxes, and losses on investments.
Categorization of expenses
- Variable Expenses: These expenses fluctuate with the level of business activity. For example, sales commissions or raw material costs may increase as sales volume rises.
- Fixed Expenses: These expenses remain constant regardless of business activity levels. Examples include rent, insurance premiums, and salaries of permanent employees.
Interpreting profitability metrics from income statements

Profitability metrics are crucial indicators of a company’s financial health and performance. Two key metrics used to assess profitability are the gross profit margin and net profit margin.
Gross Profit Margin
The gross profit margin is calculated by subtracting the cost of goods sold (COGS) from total revenue and then dividing the result by total revenue. It represents the percentage of revenue that exceeds the cost of producing goods or services.
Gross Profit Margin = ((Total Revenue – COGS) / Total Revenue) x 100%
Net Profit Margin
The net profit margin measures the percentage of revenue that remains as profit after deducting all expenses, including operating expenses, interest, and taxes. It provides a more comprehensive view of a company’s overall profitability.
Net Profit Margin = (Net Income / Total Revenue) x 100%
Significance of Profitability Metrics
Profitability metrics play a vital role in evaluating a company’s financial performance as they indicate how effectively a company is generating profits from its operations. They help investors, analysts, and stakeholders assess a company’s ability to generate returns and manage costs.
Variation of Profitability Metrics Across Industries
Profitability metrics can vary significantly across industries due to differences in business models, cost structures, and competitive landscapes. For example, industries with high competition and low barriers to entry may have lower profit margins compared to industries with unique products or services.